§ 18 - Trends
You should notice that many of the controls in the various F/x operations have a Trend button next to them. The Trend button allows you to set that variable over a sequence of frames. Each frame of the animation can be thought of as a slice of time. The trends allow you to alter some, all, or none of the variables for a particular time slice. The various settings over the sequence will create an animated effect based on the settings you specified.
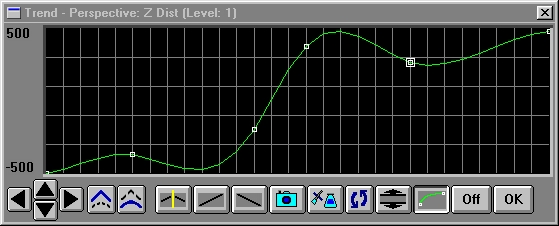
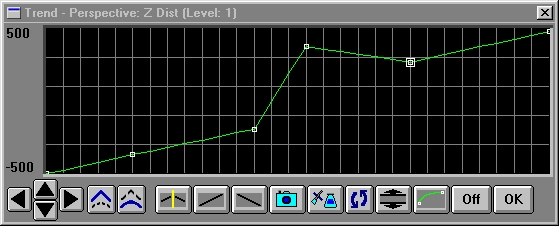
Trends can be used inside the TimeLine to specify a complex set of changes to the variables of an operation over the sequence of frames. This is similar to interpolation, but differs in that the values in the Trend can be exactly specified for each frame instead of only the first and last frames. A typical Trend graph looks something like these samples:
A Trend is accessed for a parameter by pressing the Trend button located to the right of the control. Once the Trend is open, you will see a set of vertical lines that represent the frames in the sequence. Each of these lines or frames can have a separate value. This allows you to have complete control for each frame in the sequence. The Trend is adjusted by simply "drawing" the desired curve. A curve can be drawn by pressing and holding the left mouse button while over the Trend graph. Moving the mouse will alter the setting for that frame. The current frame and parameter values are displayed in the bottom right of the Trend display. Clicking on the graph will create a control point for that frame. Each frame in the TimeLine can have a control point, but in most cases this is not necessary. You can continue to specify the desired control points in this manner until the Trend graph appears the way you want. Trend graphs will always have a minimum of two control points (start and end frame), but can have as many control points as you like. Once you have specified the desired control points, press OK to close and save the Trend for that parameter.
The Trend graph for an operation is directly related to the TimeLine, and any operations that are associated with that graph. This means that placing multiple operation icons, with multiple settings, into the TimeLine will force the generation of a Trend graph for the operations. This does not limit you to placing operations in the TimeLine to alter the Trend. This can be done by opening the operation's Trend graph after the operation is in the TimeLine. After the Trend graph is open you can adjust the settings to fit the effect you are trying to create. Adjusting the Trend will not place additional operation icons in the TimeLine. The changes in the Trend curve can only be view by opening the Trend curve. Placing another operation icon will alter the curve to reflect the new settings.
You should notice that the Trend graphs have equidistantly spaced vertical lines. Each of these lines represents a frame in the animation. The number of frames can be altered using Sequence controls... in the Timeline pull down menu. Animation lengths of 100 - 999 frames will be represented with a vertical bar being 10 frames, and animation length greater than 1000 frames will have a vertical bar for every 100 frames.
§ 18.1 - Trend Controls
The Trend dialog contains several tools to aid in the manipulation of Trend graphs:
§ 18.1.1 - Directional Arrows
The directional arrows will move the curve the specified direction. This allows you to move the curve left, right, up, or down. Moving the curve up or down will flatten the top or bottom edge. Moving the curve left or right will simply shift the graph horizontally left or right.
§ 18.1.2 - Enhance
The enhance option will increase the peaks and valleys in the curve. If you click on the enhance option the graph will then be amplified at its low and high points.
§ 18.1.3 - Smooth
The smooth option will smooth any rough edges that are detected in the graph. This option will create a smoother graph with fewer rough edges.
§ 18.1.4 - Reflect
This option, when pressed, will make the graph have reflective symmetry. This means that any changes made to the left side of the graph are reflected to the right side of the graph.
§ 18.1.5 - Rise
The increasing (rising) slope option will provide a graph that increases linearly from the minimum value to the maximum value.
§ 18.1.6 - Fall
The decreasing (dropping) slope option will provide a graph that decreases linearly from the maximum value to the minimum value.
§ 18.1.7 - Copy
The Copy Trend option allows you to take a snapshot of the current graph. The copy of the graph will be held in memory until another copy is made. This tool is useful for copying graphs to other Trends. Remember, once you make an additional copy the original will be lost.
§ 18.1.8 - Paste
The Paste Trend option allows you to paste the last graph that was copied into the current Trend graph. The paste will be an exact copy of the original. This tool is useful for creating multiple Trends that have the same graph. It is important to remember that you can copy and paste between any of the Trend graphs.
§ 18.1.9 - Flip
The Flip Trend option will flip the current graph vertically.
§ 18.1.10 - Extents
The Set Trend Extents button allows you to adjust the maximum and minimum values for a parameter. F/x will display the current upper and lower extents. as well as the theoretical maximum and minimum values. For example, if you were adjusting the Trend for the red component of a color fill, the theoretical maximum and minimum would be 255 and 0 (which is the default maximum and minimum). If you were setting the rotation parameter of a motion blur operation, the theoretical maximum and minimum would both state No Limit. This means that any value can be specified as a maximum or minimum value. You can also use the extents buttons to scale a curve. For example, if you wanted to have a linear increase in red from 0 to 100, you would set the extents to a maximum of 100 and a minimum 0f 0. You would then select the Rising Slope button to create a strictly increasing line from 0 to 100.
§ 18.1.11 - Spline
The Use Splines button toggles the Trend graph from linear to spline based lines. When this button is not selected, F/x will place straight line segments between control points. If this option is selected, then the lines between control points will used spline based curves instead of lines.
§ 18.1.12 - Off
Offl will turn the current Trend graph off. This means that any curves that have been drawn will not be used. In order for the Trend graph to be used the Trend must be left open or closed by double clicking on the System Menu box, by pressing Alt-F4, or by clicking OK.
§ 18.1.13 - OK
OK will confirm the Trend graph, and close the dialog. If this Trend has been opened from the TimeLine, the Trend information will automatically be associated with the proper key frames.
, Previous Page . Next Page t TOC i Index o Operators g Glossary
Copyright © 1992-2007 Black Belt Systems ALL RIGHTS RESERVED Under the Pan-American Conventions
WinImages F/x Manual Version 7, Revision 6, Level A
![]()