| This is a child page. You can use Parent in the quick nav bar at the top or the bottom of the page to navigate directly back to the parent of this page. Some child pages are more than one level deep, and in that case will require more than one Parent click to reach the outermost document level. |
§ 16.34 - Cellular
| Quick Reference to Scripting Command |
| a=CELL(red, green, blue, DISCRETE EDGE, TRANSPARENCY, width, height, fade in) |
| Items in CAPS are 0/1 or ranges with more options than just 0/1. Ranges other than 0/1 are indicated by brackets, such as [0-2]. |

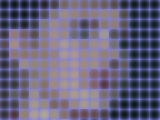
The Cellular operation is very similar to the Pixelize operation. The difference is that the Edge color fades from the edge of the cell to the center, and the cells are not necessarily the average brightness of the selected region. This operation is similar to looking at the image through colored glass bricks. You can control the size, color, and if the cells are transparent or translucent (frosted). Due to its rectangular nature, this operation is best suited for use with the Rectangle or Entire Image area selection modes.
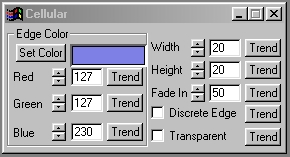
§ 16.34.1 - Cellular Controls
§ 16.34.1.1 - Trends
Operator dialog controls that have a Trend button next to them offer animation functionality. Trend allows you to set that variable over a set of frames. Each frame of the animation can be thought of as a slice of time. The trends allow you to alter some, all, or none of the variables for a particular time slice. Variables that have multiple states can be set to any of a number of values in the trend. Variables that are either on or off can only have an on or off value in the trend. You will notice that the trend graphs have equidistantly spaced vertical lines. Each of these lines represents a frame in the animation. The number of frames can be altered using Sequence controls... in the TimeLine pull down menu. Animation lengths of 100 - 999 frames will be represented with a vertical bar being 10 frames, and animation length greater than 1000 frames will have a vertical bar for every 100 frames. Click here to view more information on Trends.
§ 16.34.1.2 - Edge Color Preview Window
This preview window will display the color of the edge color that is to appear on the edges of the cells. This color will change as the Red, Green, and Blue values are altered. As the RGB controls are altered the Background color preview will be updated to reflect the changes.
§ 16.34.1.3 - Red
This slide gadget allows you to specify the Red component of the RGB value for the Cell color. This value can be altered by adjusting the sliders or by entering the values. The values for any of the RGB components range from 0 to 255.
§ 16.34.1.4 - Green
This slide gadget allows you to specify the Green component of the RGB value for the Cell color. This value can be altered by adjusting the sliders or by entering the values. The values for any of the RGB components range from 0 to 255.
§ 16.34.1.5 - Blue
This slide gadget allows you to specify the Blue component of the RGB value for the Cell color. This value can be altered by adjusting the sliders or by entering the values. The values for any of the RGB components range from 0 to 255.
§ 16.34.1.6 - Width
The Width control allows you to specify the width component of the cells to be created. The width is measured in pixels and can range from 1 to 100 pixels in size. The width can be set using the slide gadget or by entering a value in the text entry field.
§ 16.34.1.7 - Height
The Height control allows you to specify the height component of the cells to be created. The height is measured in pixels and can range from 1 to 100 pixels in size. The height can be set using the slide gadget or by entering a value in the text entry field.
§ 16.34.1.8 - Fade In
The Fade In control allows you to specify the amount of the cell's edge color that is visible. This control can be thought of as the amount of blending of the edge color and the cell color. Increasing this control will cause there to be no blending, and decreasing the Fade In value will result in a more blended edge. The setting is a percentage value that ranges from 0% to 100%. A setting of 0% will result in cells that have no edge color, and a setting of 100% will result in a cell that has the maximum amount of edge color. The Fade In value can be set using the slide gadget or by entering an appropriate value in the text entry field.
§ 16.34.1.9 - Discrete Edge
The Discrete Edge control determines the way the cells will be placed into the selected area. When the control is not selected the cells will go to the edge of the area selection, even if the cell may not be rectangular. This means that the cells at the edge of an ellipse area selection will not be rectangular, but instead will be cut off at the edge of the area select. When this control is selected, WinImages F/x will only place those cells that can be completed within the selected area. Therefore, an elliptical area select (using Discrete Edge) may only have two complete cells within it, and the non-discrete edge ellipse could have two complete cells and 5 uncompleted cells.
§ 16.34.1.10 - Transparent
The Transparent control allows you to determine if the cell is transparent or translucent. A transparent cell will have the original image bellow the edges of the cell. A translucent cell will have only the average brightness value for the area under the cell. The translucent setting is similar to the pixelize effect.
, Previous Page . Next Page t TOC i Index o Operators g Glossary
Copyright © 1992-2007 Black Belt Systems ALL RIGHTS RESERVED Under the Pan-American Conventions
WinImages F/x Manual Version 7, Revision 6, Level A
![]()