§ 12.18 - Histogram
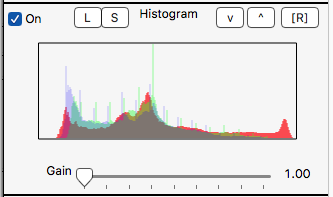
Tip: To turn the histogram on initially, don't left-click ✓ On — instead, move the gain slider. The panel will change to ✓ On by itself.
Histogram provides a graph of the number of pixels at each intensity in red, green and blue channels of the image. The most common use for this graph is to ensure that various other image adjustments have not pushed image information too far towards full brightness or black.
The Gain slider allows you to raise the levels of the histogram; at the left, the most common level will exactly reach the top of the graph. This level of gain can hide small graph values, and so you use Gain to amplify everything so you can see the lower levels. Histogram has no effect on the image, it is simply a measurement tool.
Keyboard Navigation
, Previous Page . Next Page t TOC i Index o Operators g Glossary
, Previous Page . Next Page t TOC i Index o Operators g Glossary
on February 27th, 2026 at 17:36 MT
| Please consider supporting my dTank (β) development efforts via a small PayPal donation. |